What is frequency response?
Know your instruments.
Frequency response is the way audio equipment changes the frequencies we send to it.
In other words: it is the way its related instrument is going to “sound”; the way said instrument is going to alter the frequencies it receives.
Be aware: an audio signal is not characterized by frequencies alone, but by phases too. Which is going to be drawn into a different graph, called phase response curve.
It is a fundamental feature of sound. But, in case of music production, given the quality of modern equipment, it is usually unimportant.
The same concept doesn’t hold true in case of live audio systems, in which phase plays a crucial role due to the strong environmental interactions involved. Like wind, humidity, and the huge size of arenas, for example.
If you want to delve deeper in this topic, at this link you will find more information about it.
The most used method to illustrate a frequency response is the frequency response chart.
On the vertical axis, the graph will show how the instrument is going to alter frequencies. That is, the dB value of its chromatic variation (“chromatic” in that the frequential components of a sound are going to define its “color”. In other words, its timbral capacities).
On the horizontal axis, the graph will show which frequency is altered.
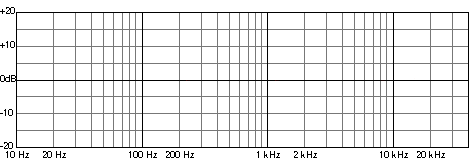
The one above was an example of an empty graph.
Now, let’s see a frequency response curve within the graph.
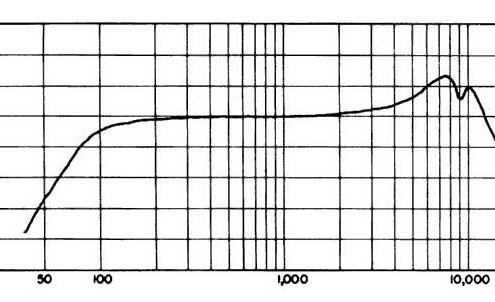
Frequency response chart.
The curve inside this graph is the frequency response.
Understanding this graph is very easy.
For example, we can infer that this instrument is going to subtract 20 dB to a 30 Hz soundwave, with respect to the original sound. For a 40 Hz soundwave it will subtract 10 dB. For a 300 Hz soundwave it will subtract about 3 dB.
Speaking about this example only, we’re debating about an instrument that’s quite reliable for sounds above 100 Hz, in that a variation of +/- 2 dB is considered to be acceptable for professional standards.
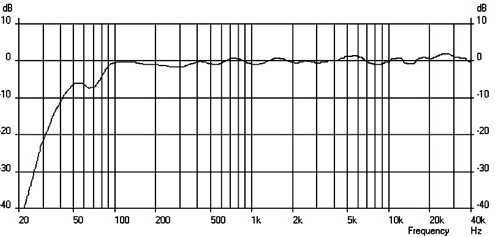
Let’s now see the graph of a remarkably reliable instrument.
Excellent frequency response.
Apart from a peak at 10 kHz, where 10 dB are added (something that can be easily corrected in post production, if needed), this instrument will not alter the original signal at all.
An instrument with such a linear graph is a reliable one.
In fact, it is the frequency response of one of our favourite microphones during orchestral recordings.
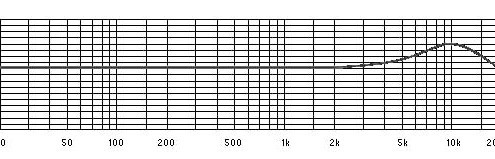
Let’s now see the graph of an average instrument.
Risposta in frequenza nella media
This instrument is not reliable below 100 Hz, and it shows some anomalies around 7 kHz that may result quite annoying.
But all in all, it’s a reliable instrument in situations where a complete tonal fidelity is not required. Like, for example, noisy live shows.
In fact, it is the frequency response of a quite common dynamic microphone.
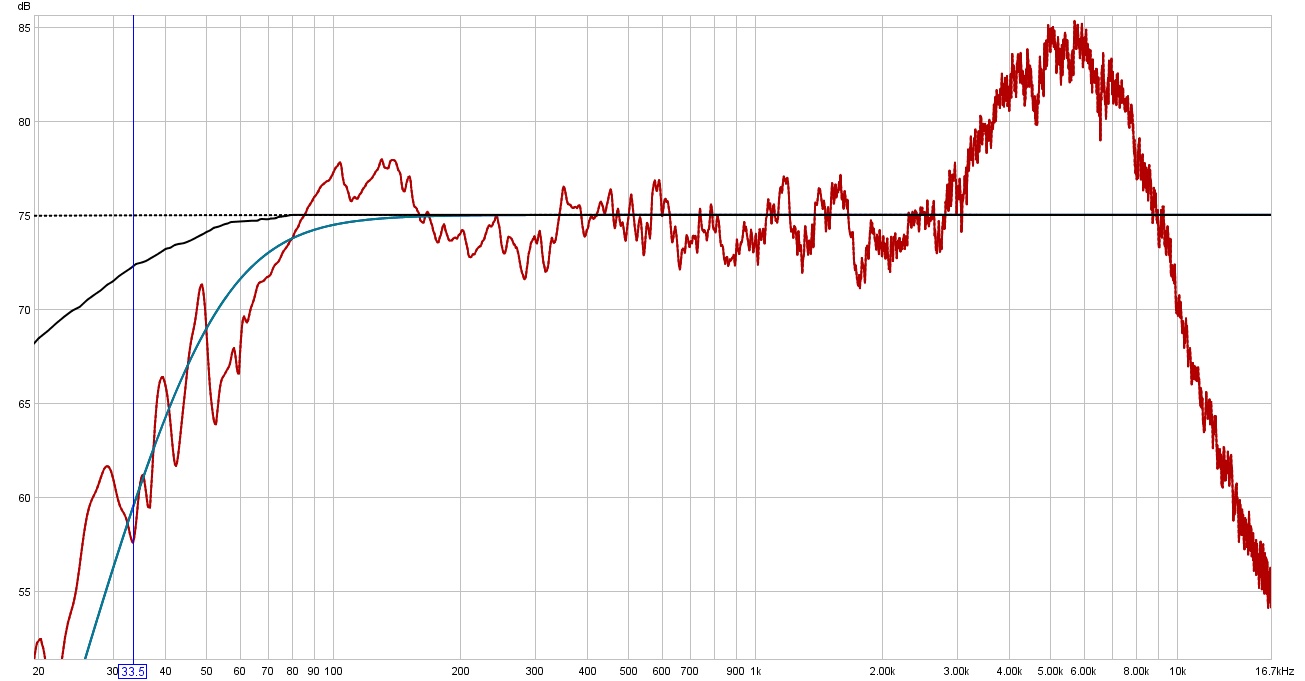
Let’s now see a graph of an awful instrument.
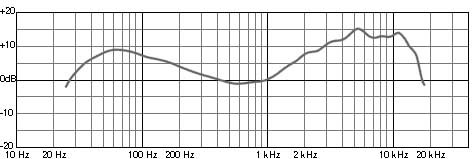
Grafico risposta in frequenza pessima
If you see an instrument with a frequency response that shows so many pronounced anomalies, leave it on the shelf: it is not a reliable instrument.
That is, unless you didn’t come up with a terribly eccentric idea for your recordings.
Additionally, if you see graphs that show multiple curves for a single instrument, like this one for example
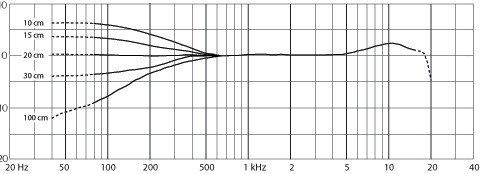
Effetto prossimità.
don’t worry: it’s nothing but the proximity effect.
Some kinds of microphones change their behaviour depending on their distance from the sound source being recorded.
These graphs show how the instruments will react depending on this distance, displaying different curves for different distances.
As odd as it may seem, this system will allow you to understand how an instrument is going to sound without ever listening to it at all.
Except for some uncommon exceptions, that we will cover in other articles.
If you want to know why this tutorial was made, you’ll find out more in this post:
And you got our entire website to hear if we’re talking about something that we can do.
We want to hear about you!
If you found this post useful, please: share your experience with us on our social pages!
Maybe together with a link to what you’ve created, and using our official hashtag #lmkmprod to let us find you all.
We’re looking forward to hear about you!


Leave a Reply
Want to join the discussion?Feel free to contribute!